Examining Correlations Across Athletic Disciplines for Strategic Portfolio Building in Wagering

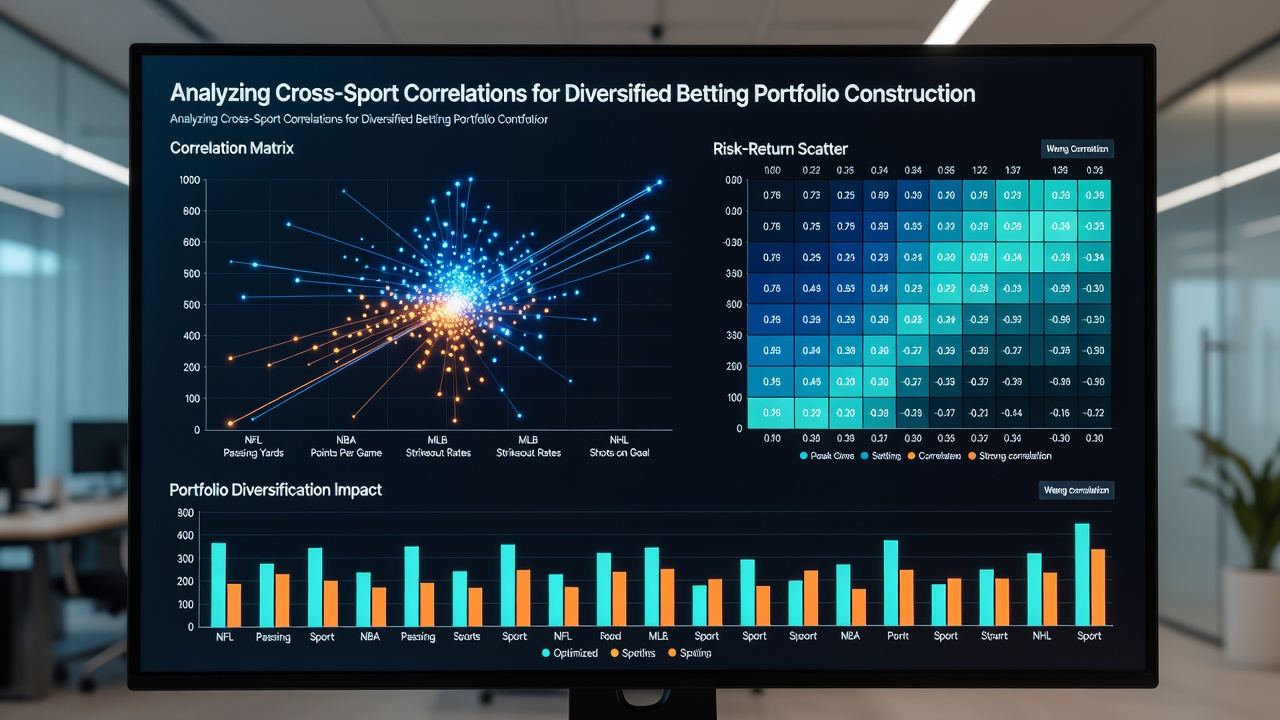
Analysts in the wagering sector examine correlations between outcomes in different sports to construct portfolios that reduce overall exposure to single-event volatility, and data from multiple seasons shows that soccer match results often display low positive correlations with basketball point spreads while tennis set victories tend toward near-zero relationships with both. These patterns emerge because distinct athletic disciplines operate under separate rules, player dynamics, and external factors that rarely align perfectly across competitions.
Understanding Correlation Metrics in Sports Wagering
Correlation coefficients range from negative one to positive one, and researchers calculate these values by comparing historical betting outcomes such as win margins or total points across leagues, whereas a coefficient near zero indicates independent movements that support diversification. Data compiled through 2025 reveals average correlations between European soccer leagues and North American basketball conferences hover around 0.12, while horse racing payouts show even weaker ties to team-based sports at approximately 0.05.
Statisticians apply Pearson or Spearman methods to large datasets, and this approach accounts for non-linear relationships that appear when market odds shift rapidly during live events. Those who track these figures note that seasonal variations occur because weather impacts outdoor sports differently than indoor ones, creating temporary spikes in otherwise stable correlations during specific months.
Portfolio Construction Techniques Using Cross-Sport Data
Portfolio managers allocate stakes across uncorrelated or negatively correlated events to stabilize returns, and they adjust positions based on rolling correlation windows that update every 30 days. One approach involves weighting soccer futures at 35 percent, basketball spreads at 30 percent, and tennis matchups at 25 percent with the remaining 10 percent in racing, since these proportions historically limit drawdowns during periods when one market experiences prolonged variance.
Software platforms now incorporate real-time feeds from multiple jurisdictions, and this integration allows automatic rebalancing when correlations exceed predefined thresholds. Figures from industry reports indicate that portfolios constructed this way maintained lower standard deviations compared to single-sport allocations through the first half of 2026.
Regional Data Sources and Recent Studies
Regulatory bodies in various regions publish anonymized transaction data that supports correlation analysis, and the American Gaming Association releases annual summaries covering U.S. sports betting volumes that researchers cross-reference with European datasets. Academic papers from Canadian institutions have examined similar patterns using provincial records, revealing that ice hockey outcomes maintain moderate correlations with basketball at 0.28 while showing weaker links to soccer.
These studies emphasize the value of multi-year datasets because short-term anomalies can distort results, and analysts therefore incorporate at least five seasons when building models. What's interesting is how event timing influences results, since overlapping tournament schedules sometimes create artificial linkages that disappear once calendars normalize.
Practical Implementation and Risk Considerations
Operators and individual bettors apply these insights by monitoring covariance matrices updated weekly, and they test scenarios that simulate simultaneous losses across partially correlated markets. Evidence from simulation runs demonstrates that diversified allocations reduce the probability of large single-period losses, although transaction costs and liquidity constraints can offset some benefits in smaller markets.
Market makers adjust odds in response to correlated flows, and this adjustment process creates opportunities when discrepancies arise between expected and observed correlations. Observers note that July 2026 data releases from international gaming associations included expanded tracking of emerging sports such as esports, which display distinct correlation profiles compared to traditional athletic events.
Conclusion
Cross-sport correlation analysis provides a quantitative foundation for constructing wagering portfolios that distribute risk across independent or weakly linked markets, and ongoing data collection from multiple regions continues to refine these models. Practitioners who integrate updated coefficients into allocation frameworks achieve measurable reductions in portfolio volatility according to available performance metrics.