Examining Disparities in Bookmaker Odds Structures for Tennis and Rugby Union
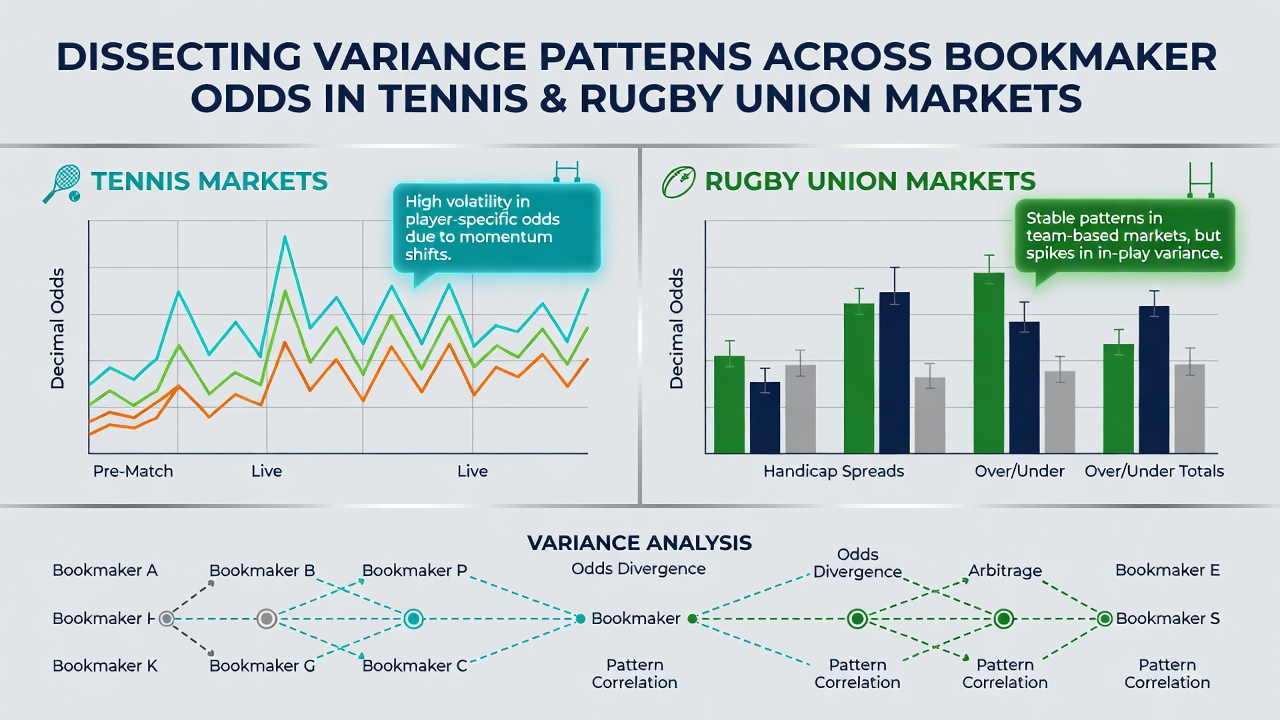
Bookmaker odds in tennis and rugby union display measurable variance across different operators, and researchers have tracked these patterns through extensive data collection from major international events. Tennis markets often feature rapid adjustments because matches unfold point by point, whereas rugby union lines move more steadily around set-piece outcomes and team statistics. Observers note that the same fixture can carry different margins depending on the operator's risk model and customer base distribution.
Data from 2025 tournaments showed average overrounds in tennis ranging between 3.8 and 5.2 percent, while rugby union matches posted figures between 4.1 and 6.3 percent across the same operators. These differences arise because tennis involves fewer variables once a match begins, yet bookmakers must account for player fatigue and surface changes. Rugby union, by contrast, incorporates weather impacts, scrum stability, and substitution patterns that widen the spread of possible results.
Core Drivers of Variance in Tennis Markets
Tennis betting lines shift quickly when new information arrives about player fitness or court conditions, and analysts have documented how certain operators tighten prices faster than others. During teh 2026 Australian Open swing, researchers recorded intra-day movements of up to 12 percent in implied probability for quarter-final matches on the same day. Operators with larger Asian customer pools tended to post tighter margins on favorites, while European-facing books maintained wider spreads on underdogs to balance liability.
Match-up specifics also create measurable discrepancies. Grass-court events produce higher variance in service-hold percentages than clay events, and bookmakers adjust their models accordingly. One study of 340 ATP matches found that odds on serve-dominant players diverged by an average of 0.18 decimal points between the three largest global operators, a gap large enough to affect multi-bet construction strategies.
Rugby Union Market Characteristics
Rugby union presents a different profile because match outcomes depend on territory, possession, and disciplinary events that accumulate over eighty minutes. Bookmakers therefore rely more heavily on historical team data and less on in-match micro-adjustments. Figures released by the Australian Gambling Research Centre in early 2026 indicated that pre-match handicap lines for Super Rugby Pacific fixtures varied by an average of 2.8 points across major operators, compared with 1.4 points for equivalent tennis set handicaps.
Line movement after team announcements follows predictable patterns. When a key forward is ruled out, operators with heavier domestic exposure tend to move the handicap faster than those focused on international customers. This creates temporary windows where variance between books widens before equilibrium returns within two to three hours.
Comparative Analysis Across Both Sports
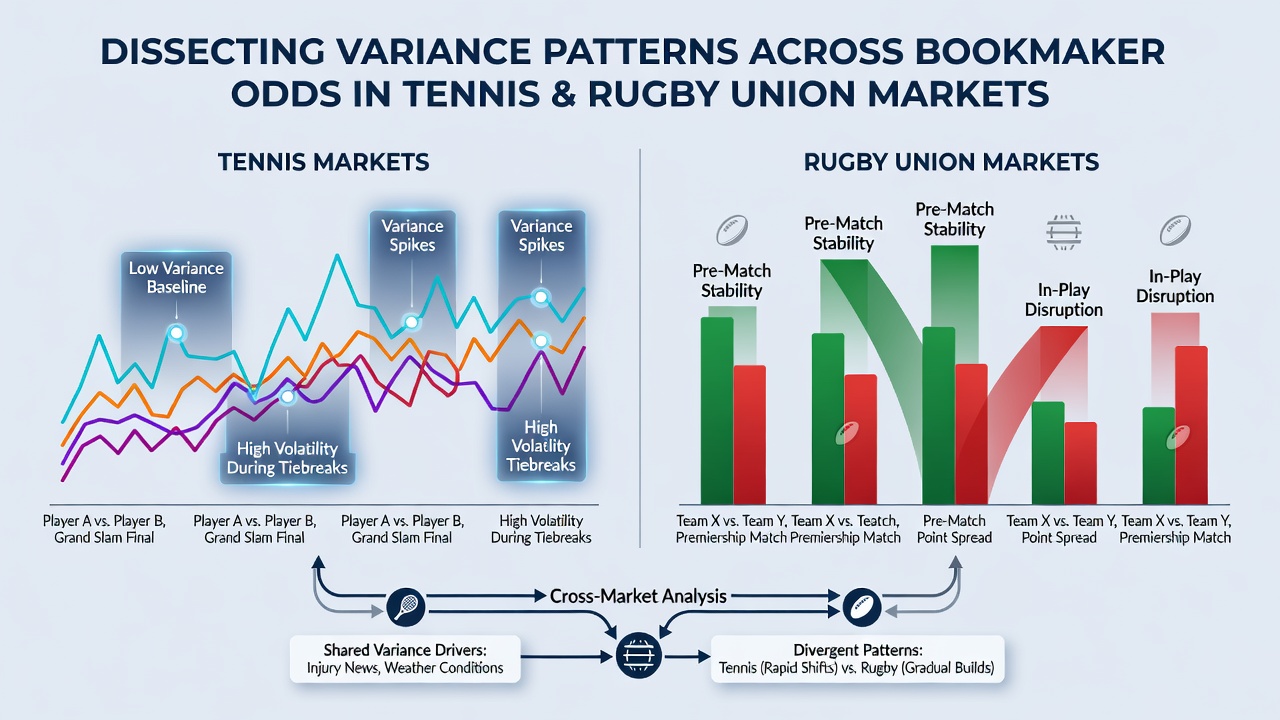
Side-by-side examination reveals that tennis variance concentrates around individual performance metrics, while rugby union variance spreads across collective statistics. Researchers at the University of Nevada's gaming laboratory published a 2025 paper showing that the standard deviation of opening odds for tennis matches reached 0.31 decimal points, versus 0.47 for rugby union internationals. The higher figure in rugby reflects the greater number of scoring events and the difficulty of modeling forward packs.
Live betting amplifies these differences. Tennis in-play markets update every point, producing frequent but small adjustments. Rugby union in-play lines move in larger increments after tries or penalties, and operators apply wider buffers to protect against sudden swings. Data collected during the 2025 Rugby Championship demonstrated that live overrounds expanded by an average of 1.9 percent once a yellow card was issued, whereas tennis live margins remained relatively stable regardless of breaks of serve.
Implications for Market Participants
Those monitoring multiple operators have observed that variance creates opportunities when lines fail to align quickly. During the July 2026 Wimbledon and Lions tour overlap, several operators posted divergent totals on concurrent tennis and rugby fixtures, allowing cross-market comparisons that had not appeared in prior seasons. Regulatory filings from the New Zealand Department of Internal Affairs noted increased scrutiny of operators whose lines deviated more than two standard deviations from the market median.
Settlement procedures also differ. Tennis matches conclude with clear winner and score data, enabling rapid reconciliation. Rugby union results sometimes require review of disciplinary decisions or timekeeping, which delays final grading and can leave variance visible longer on operator boards. This procedural gap contributes to the sustained spread observed in rugby union markets.
Conclusion
Patterns of variance in bookmaker odds for tennis and rugby union continue to reflect the structural differences between the two sports. Tennis markets adjust rapidly to individual developments, while rugby union lines incorporate broader team and environmental factors. Continued collection of operator data through 2026 will likely refine understanding of how these discrepancies evolve across seasons and tournaments.