Global Trends in Seasonal Participation for Chance-Based Games and Key Influencing Factors
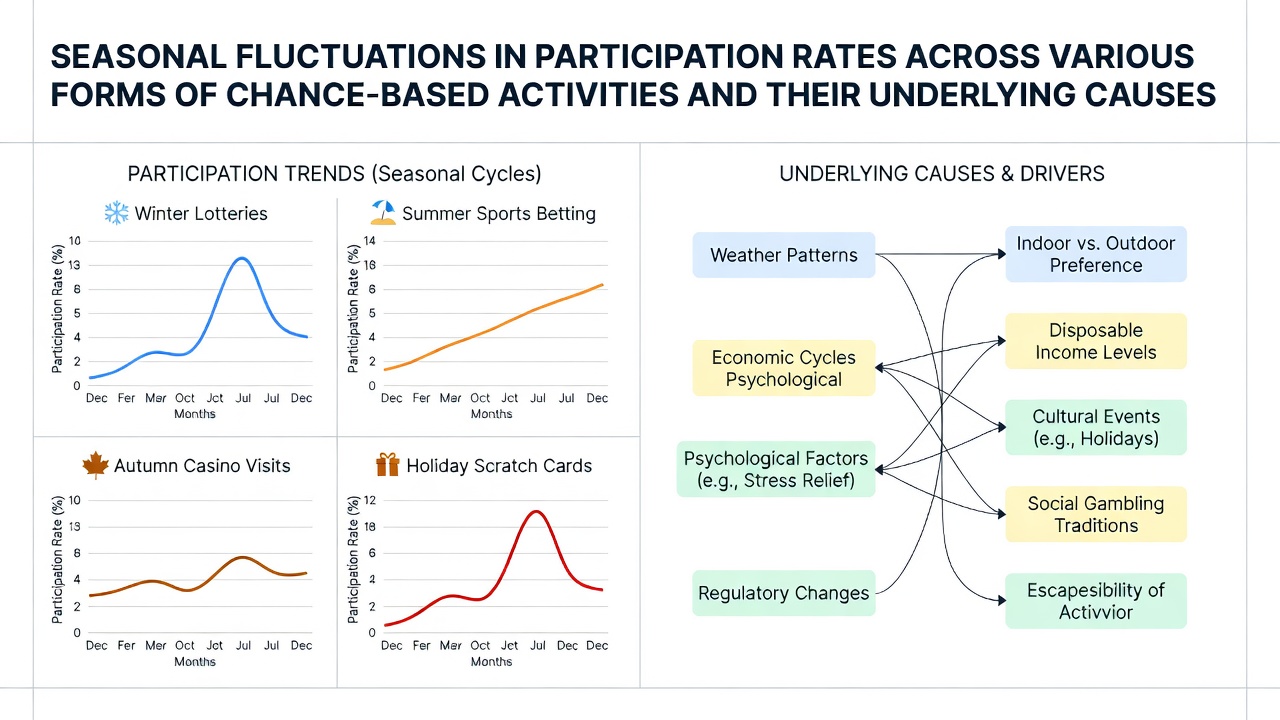
Participation in lotteries, casinos, and online gaming platforms shows clear seasonal patterns that researchers track through sales data and survey responses, and these cycles often align with holidays, weather shifts, and major sporting calendars. Data collected across North America, Australia, and parts of Europe reveal consistent peaks during winter months and holiday periods while summer frequently brings measurable declines in certain activities.
Observed Patterns Across Different Activities
Lottery ticket sales tend to rise sharply in December and January in multiple jurisdictions because gift purchases and New Year traditions encourage higher volume, whereas sports betting volumes follow professional league schedules with notable spikes during championship months and dips during off-seasons. Casino foot traffic in colder climates increases between November and February when indoor entertainment options gain preference, yet the same venues report steadier or lower attendance in warmer periods when outdoor recreation competes for attention.
Online gaming platforms display their own rhythms, with engagement climbing during extended holiday breaks and school vacations while dipping when people spend more time traveling or pursuing seasonal hobbies. Researchers have documented these trends through longitudinal datasets that compare monthly active user counts year over year, and the patterns hold across both regulated land-based operations and digital channels.
Primary Drivers Behind the Fluctuations
Weather conditions play a substantial role because prolonged cold or rainy periods keep more individuals indoors where gaming and lottery purchases become convenient pastimes, whereas extended periods of sunshine and mild temperatures correlate with reduced indoor activity. Economic factors tied to specific months also matter, such as tax refund seasons in early spring that temporarily boost discretionary spending on chance-based products in the United States and Canada.
Holiday calendars create predictable surges, with Christmas, New Year, and major cultural festivals driving gift-related lottery sales and increased casino visits, while summer vacation periods spread consumer attention across travel, festivals, and outdoor events. Sports calendars exert additional influence on betting participation, with concentrated interest during playoffs and championship events followed by quieter intervals between seasons.
Regional Data and Comparative Insights
Figures from the Responsible Gambling Council in Canada indicate that lottery participation rises approximately 15 to 20 percent during December compared with summer averages in several provinces, while casino revenues in similar regions follow parallel winter increases. Australian government reports on gaming expenditure show comparable holiday peaks alongside summer declines linked to outdoor leisure preferences in the southern hemisphere.
Studies examining U.S. state lottery data reveal that jackpot rollovers during slower months can partially offset typical seasonal dips, yet overall participation still tracks broader weather and calendar patterns. In Europe, national operators outside the United Kingdom document similar cycles where winter months generate higher online gaming volumes while summer tourism reduces local participation rates.
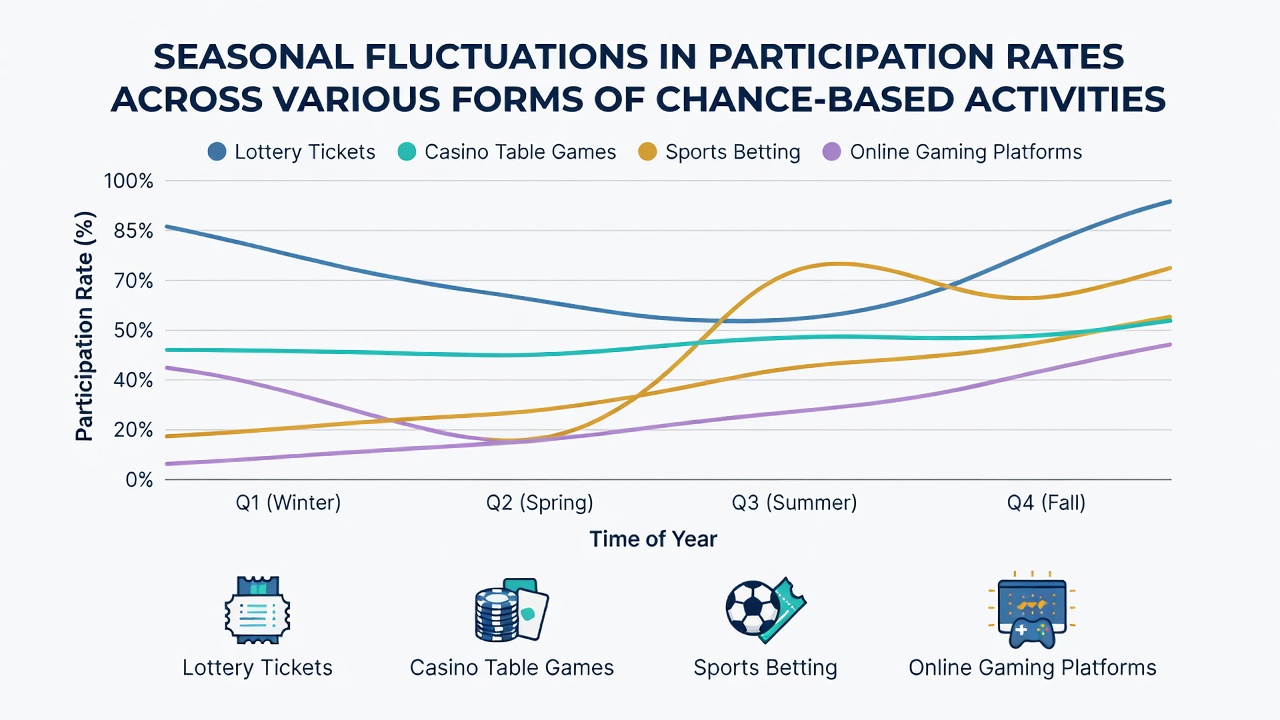
June 2026 data snapshots from multiple North American operators already show early signs of the expected summer moderation, with lottery sales softening compared with spring peaks and online gaming session lengths shortening as outdoor activities resume across many regions. These observations align with multi-year trends rather than representing isolated anomalies.
Secondary Influences and Interacting Factors
Marketing campaigns timed around holidays amplify existing seasonal tendencies, while regulatory changes or tax adjustments can create temporary deviations from established patterns. Demographic differences also appear in the data, with younger adults showing stronger summer declines in certain gaming categories compared with older cohorts who maintain more consistent year-round participation.
Technological access further modulates these cycles because mobile gaming allows continued engagement during travel periods that once produced sharper drops, although overall volume still reflects broader seasonal preferences. Observers note that jackpot size announcements can temporarily override weather-related slowdowns, yet the underlying calendar effects reassert themselves once the exceptional prizes normalize.
Conclusion
Seasonal fluctuations in chance-based activity participation stem from the combined effects of weather, holidays, sports schedules, and economic timing, and these patterns appear consistently across diverse geographic regions and product types. Ongoing data collection from government agencies and research organizations continues to refine understanding of how these factors interact, providing operators and policymakers with clearer pictures of predictable cycles that shape engagement throughout the year.