Payout Structures and Strategic Risk in Poker Tournaments: A Detailed Examination

Competitive poker tournaments operate under payout structures that directly influence how players approach risk throughout each stage of play, and data from major circuits shows these structures vary widely between flat distributions and heavily top-heavy formats. Researchers have examined how Independent Chip Model calculations shift when final table payouts reward first place with 40 percent or more of the prize pool versus events that spread awards more evenly across the top 20 percent of finishers.
Core Elements of Tournament Payout Design
Organizers set payout percentages according to field size and total buy-ins, while flat structures allocate smaller increments between places and top-heavy formats concentrate larger sums at the top three positions. According to reports from the Nevada Gaming Control Board, events with 500-plus entrants commonly adopt structures where the winner receives between 25 and 35 percent of the pool, and these choices affect survival thresholds at every pay jump. Players adjust aggression levels once they reach the money because the marginal value of chips changes with each successive payout tier.
Risk Metrics Players Apply
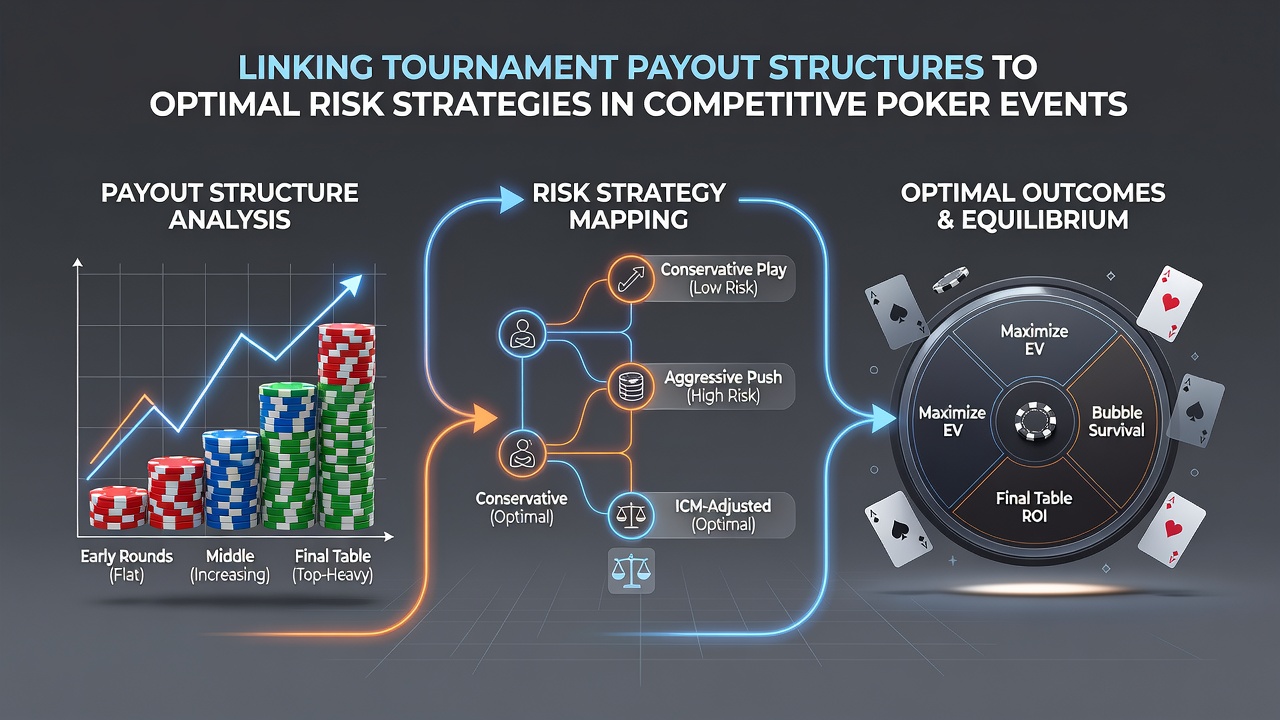
Optimal risk strategies rely on chip expected value during early stages when survival pressure remains low, yet shift toward ICM considerations as the field shrinks and pay jumps grow larger. Studies from academic gaming research groups indicate that participants in top-heavy events accept higher variance lines near the final table because the upside of doubling up outweighs the risk of elimination, whereas flatter payout events reward tighter ranges that preserve stack depth across multiple pay jumps. Tournament software now provides real-time ICM outputs that quantify these trade-offs for each remaining player.
Linking Payouts to Decision Thresholds
Observers note that when payout structures award the top three places with disproportionate shares, players widen opening ranges from the button once they reach the final two tables because the reward for accumulating chips rises sharply. In contrast, flatter structures produce tighter preflop defense because the difference between 12th and 8th place remains modest relative to the overall pool. Data collected across European circuits demonstrates that average stack depths at the final table correlate with payout steepness, and deeper stacks appear more frequently in events that spread prizes across more positions.
One documented pattern emerges during July 2026 festival schedules where multiple series adopted hybrid structures that blend flat early payouts with accelerated final-table increments, and these adjustments prompted measurable changes in three-bet frequencies according to hand-history databases shared by participating rooms.
Practical Examples from Recent Circuits
Take one mid-stakes series that implemented a 30 percent top-heavy payout in 2025, where solvers recommended wider call ranges on the river once stacks fell below 15 big blinds because the equity required to justify a call dropped compared with flatter formats. Another event maintained a flatter ladder through the top 15 percent of finishers, and participants displayed lower all-in frequencies on earlier streets as measured by live-stream analytics. These differences illustrate how payout design alters the break-even points embedded in risk calculations without changing the underlying cards or betting rules.
Software and Analytical Tools
Industry reports from the American Gaming Association highlight increased adoption of ICM-based training modules that allow players to input specific payout tables before sessions begin, and these tools generate position-specific ranges that adapt as pay jumps approach. Regulatory filings from Canadian provincial gaming authorities further note that licensed tournament operators must publish payout structures in advance, which enables participants to prepare risk models ahead of time rather than reacting during play.
Conclusion
Payout structures establish the mathematical framework within which optimal risk strategies develop, and players who map ICM values to specific ladders gain clearer guidance on when to widen ranges or tighten defense. Continued collection of hand data across varied formats will refine these connections while software continues to translate payout percentages into actionable thresholds at the table.