Weather Variables Shaping Run Production and MLB Wagering Markets
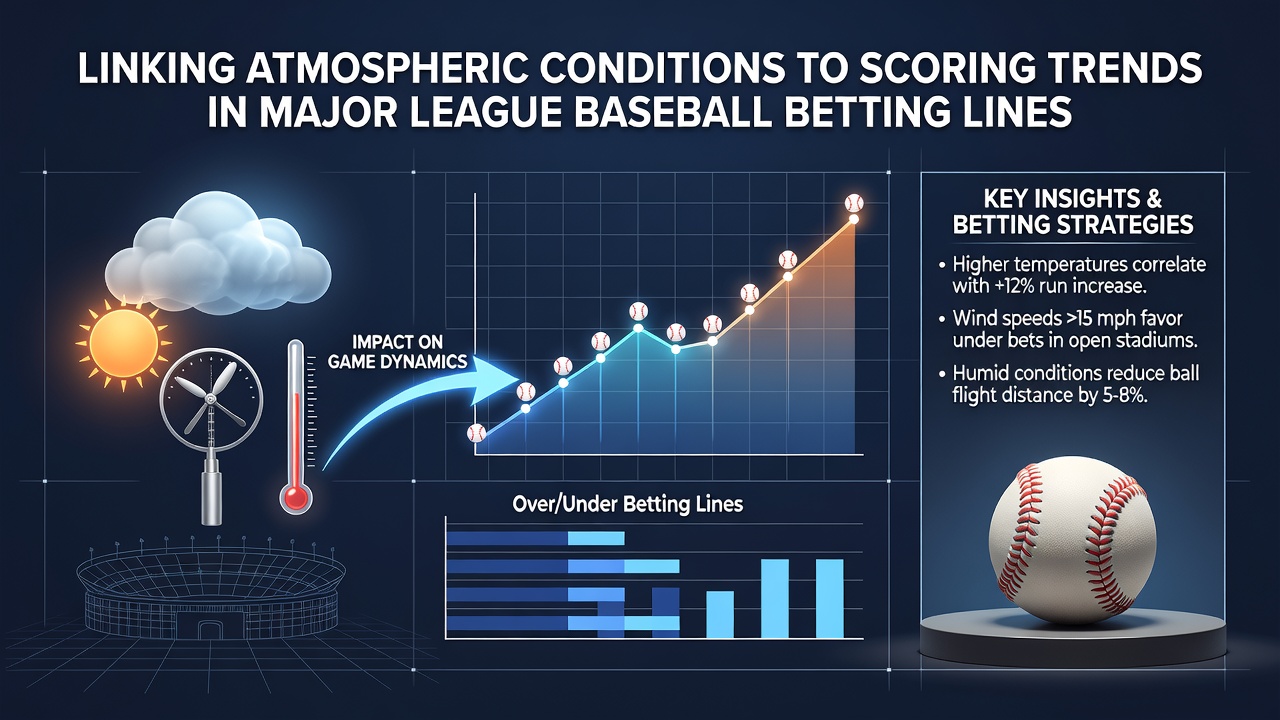
Atmospheric conditions exert measurable influence over run totals in Major League Baseball, and betting markets adjust lines accordingly when forecasters release updated data. Temperature, humidity, wind speed and direction, plus barometric pressure combine to alter ball flight, player grip, and overall scoring output, prompting oddsmakers to revise totals and side markets before first pitch.
Primary Atmospheric Elements and Their Effects
Temperature stands out as teh most documented variable because warmer air reduces air density and allows batted balls to carry farther, while colder conditions compress flight paths and suppress extra-base hits. Researchers tracking decades of play-by-play data have quantified that each additional degree Fahrenheit above 70 correlates with a measurable uptick in home-run frequency, particularly at lower-elevation parks. Humidity adds another layer because higher moisture content increases air density even as it softens the ball's surface, slightly reducing carry yet simultaneously affecting pitcher grip and spin rates.
Wind direction and velocity shift outcomes more dramatically in open stadiums than in retractable-roof venues. A sustained breeze blowing out to the outfield can add 20 to 30 feet of carry to fly balls, pushing marginal fly-outs over fences, whereas incoming winds keep balls in the infield. Barometric pressure changes that accompany weather fronts also register small but consistent effects on scoring, with falling pressure often coinciding with increased run environments across multiple studies.
Documented Scoring Trends Across Seasons
Analysis of historical box scores reveals that games played above 85 degrees Fahrenheit produce elevated run rates compared with contests below 65 degrees, and the gap widens in night games when temperature differentials between day and evening widen. Data collected through 2025 and into the first half of 2026 shows that totals lines in warm-weather markets such as Texas and Arizona move upward more frequently than in cooler coastal venues, reflecting both actual environmental impact and sharp bettor awareness of these patterns.
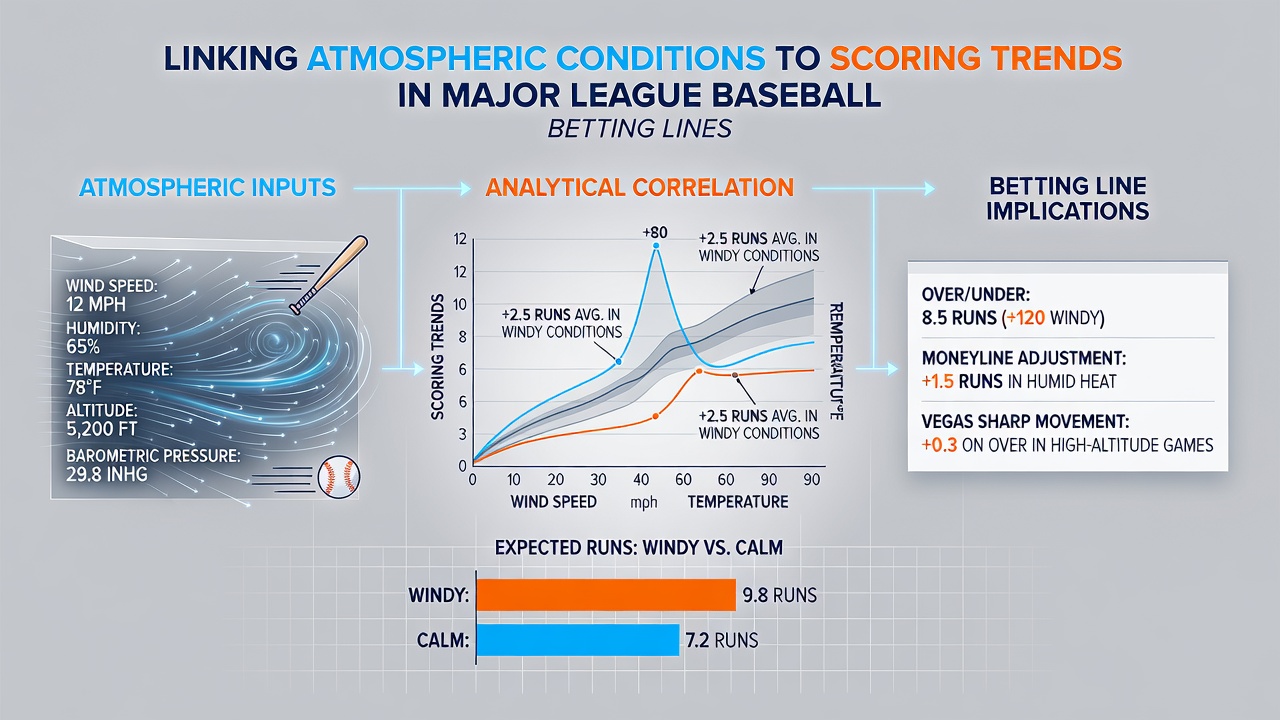
Humidity thresholds above 70 percent have been linked to modest declines in home-run rates because the denser air offsets some temperature-driven carry advantages. Observers tracking pitch-tracking systems note that elevated humidity also correlates with slight increases in wild pitches and passed balls, further nudging expected run totals higher in certain parks. Wind studies conducted at Wrigley Field and Fenway Park demonstrate that consistent outfield breezes can add roughly half a run per game to projected scoring, a margin large enough to influence both over-under and run-line markets.
Market Adjustments and Line Movement
Oddsmakers incorporate real-time weather feeds into their models, and lines frequently shift when updated forecasts alter expected run environments. A sudden temperature spike or wind reversal can move a total by half a run within hours, creating opportunities for bettors who monitor meteorological updates alongside injury news and pitching matchups. Sportsbooks in regulated U.S. markets publish weather-adjusted totals that reflect these inputs, while international operators sometimes lag in incorporating the same granular data.
Line movement tied to atmospheric forecasts tends to accelerate in July, when heat and humidity peak across much of the continental United States. During the 2026 season, several series in the Midwest and Southwest saw totals climb after midday temperature projections rose above seasonal averages, illustrating how quickly markets respond to environmental signals. Sharp bettors who cross-reference National Weather Service bulletins with park factors often identify value before lines stabilize.
Regional and Venue-Specific Patterns
Coors Field in Denver remains the clearest example of altitude-weather interaction because thinner air at elevation amplifies temperature and wind effects, producing consistently higher scoring regardless of forecast. In contrast, marine-layer venues along the West Coast experience smaller swings because cool, moist air moderates daily temperature ranges. Analysts comparing these parks find that totals lines at altitude move more aggressively on warm, windy days than at sea-level stadiums where conditions remain more stable.
Studies from institutions such as the National Oceanic and Atmospheric Administration supply the granular forecast data that feeds into advanced baseball analytics platforms. Those platforms combine historical park factors with projected atmospheric variables to generate run-expectancy models that sportsbooks and professional bettors both consult. As forecasts improve in resolution, the precision of weather-based line adjustments continues to tighten.
Conclusion
Atmospheric conditions supply a quantifiable input that shapes run production and, by extension, the movement of Major League Baseball betting lines. Temperature, humidity, wind, and pressure each register measurable effects that accumulate across a season, prompting oddsmakers to revise totals and creating windows for informed wagering when forecasts shift. Continued refinement of weather models and their integration into sports analytics ensures these environmental factors remain central to understanding scoring trends and market behavior throughout the 2026 campaign and beyond.